Buildout Overview
The basement is now doing two jobs at once: studio and server host. The studio is intentionally simple, just a green screen wall and a demo table, because the focus is repeatable technical demonstrations across multiple industry verticals. Right behind that space is the local compute footprint that powers the demos.
This buildout adds two custom Tenstorrent server paths to my existing NVIDIA-enabled and general-purpose server stack. I wanted one lab I could re-point at a different demo scenario in an afternoon, rather than standing up a fresh one-off rig every time a new vertical came up.
The broader architecture is hybrid by design. I want the same local inference flow to run against multiple cloud providers, plus a purely local mode when connectivity is not there. That gives me a practical way to show customers and internal teams what edge-first compute can do, and where cloud orchestration actually earns its place.
Two terms do a lot of work below: Private Cloud means the self-hosted infrastructure in my server room, and Local means execution paths that never leave it, including the equivalent services running in Kubernetes.
Private Cloud Topology
 (opens in a new tab)
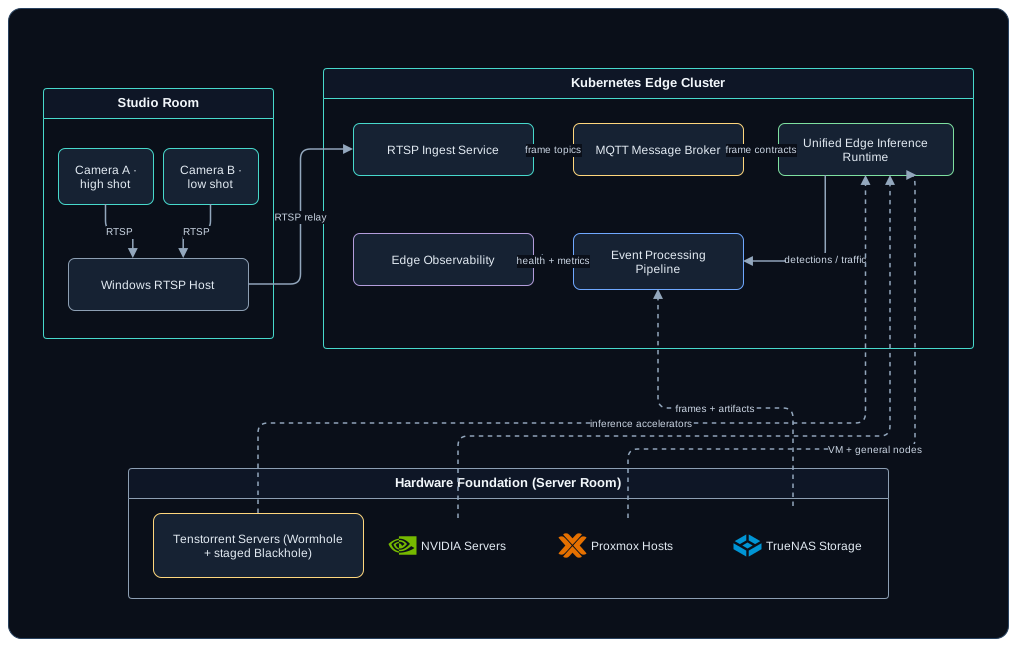
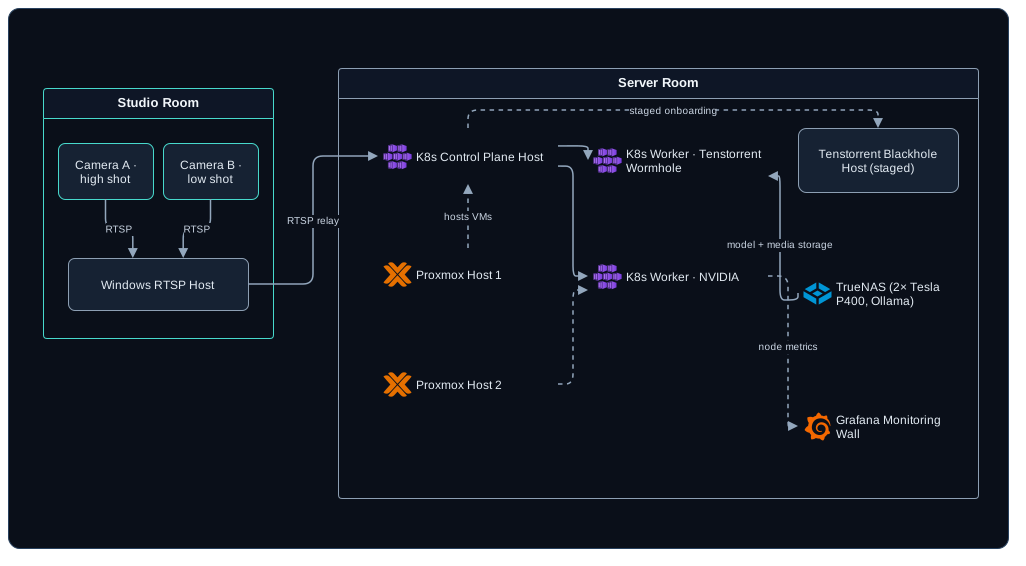
That is the whole lab in one frame: studio cameras and a Windows RTSP host on the left, the Kubernetes edge cluster in the middle (K3s, the lightweight single-binary Kubernetes distribution) with Tenstorrent and NVIDIA workers under it, and TrueNAS holding models and media. Every diagram after this one is the same picture with a different control plane bolted onto it.
Azure Integration View
 (opens in a new tab)
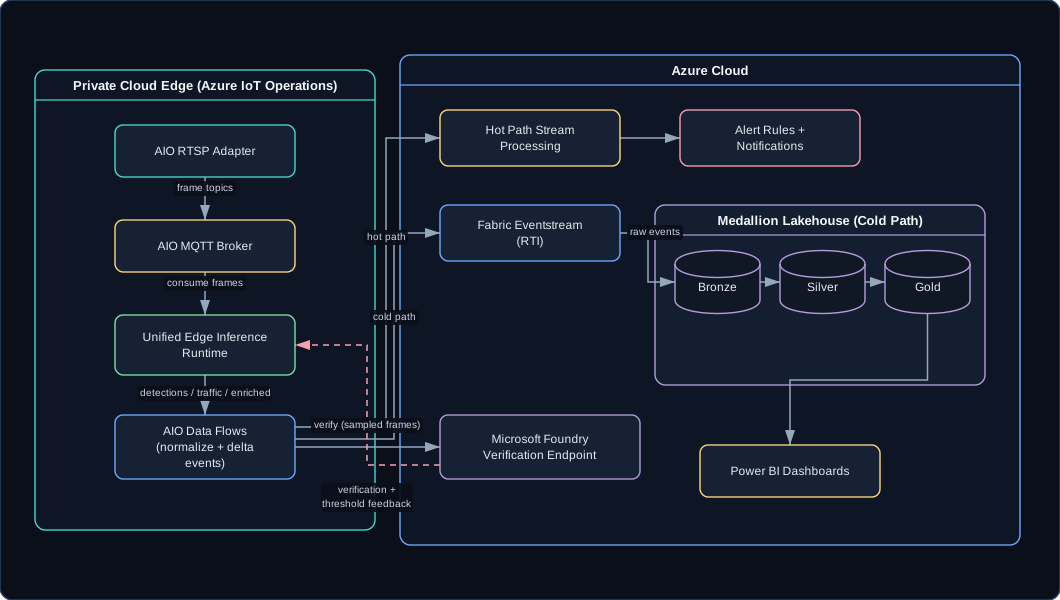
Same edge, Azure on the right. What is new here is IoT Operations splitting traffic into a hot path for alerting and a cold path into the medallion lakehouse, with Fabric Real-Time Intelligence (RTI) as the streaming ingestion surface and a verify worker calling a Microsoft Foundry endpoint. The arrow I actually care about is the one coming back: verification and threshold feedback into the edge runtime.
Control Plane Overlay (Azure + Private Cloud)
 (opens in a new tab)
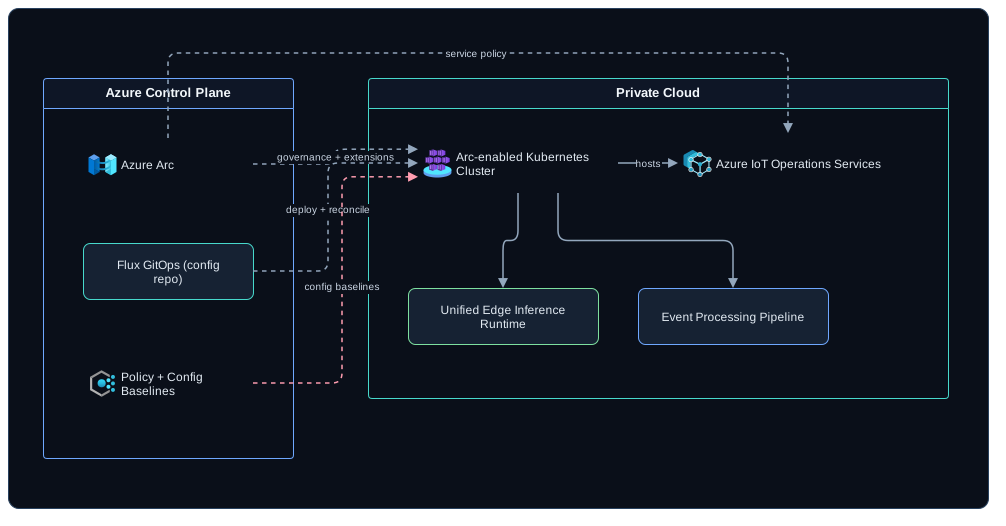
This one drops the data path entirely and shows only who configures whom: Arc and Flux applying policy and config baselines to the same cluster the previous two diagrams route messages through. I draw them separately because they fail separately - a broken GitOps reconcile and a broken frame topic are different pages of a runbook.
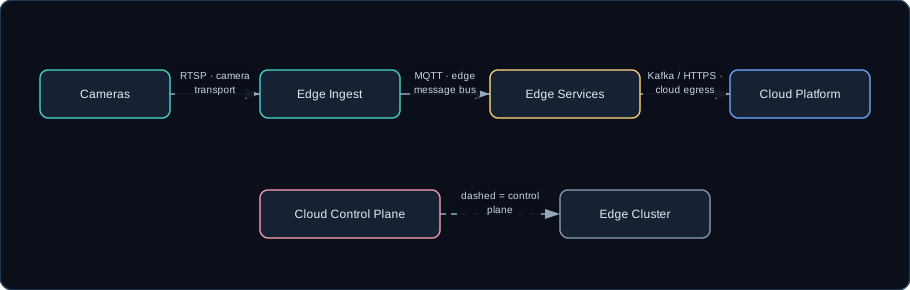
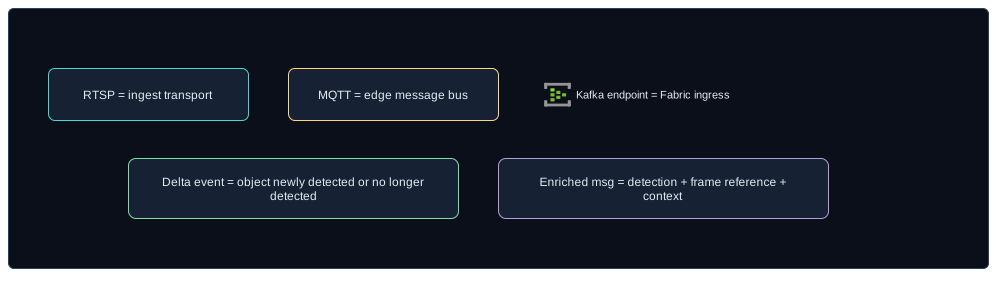
The card below is the legend for all of these: solid arrows are the data plane, dashed arrows the control plane, and the three transports are RTSP, MQTT, and Kafka over HTTPS.
 (opens in a new tab)
AWS Integration View
 (opens in a new tab)
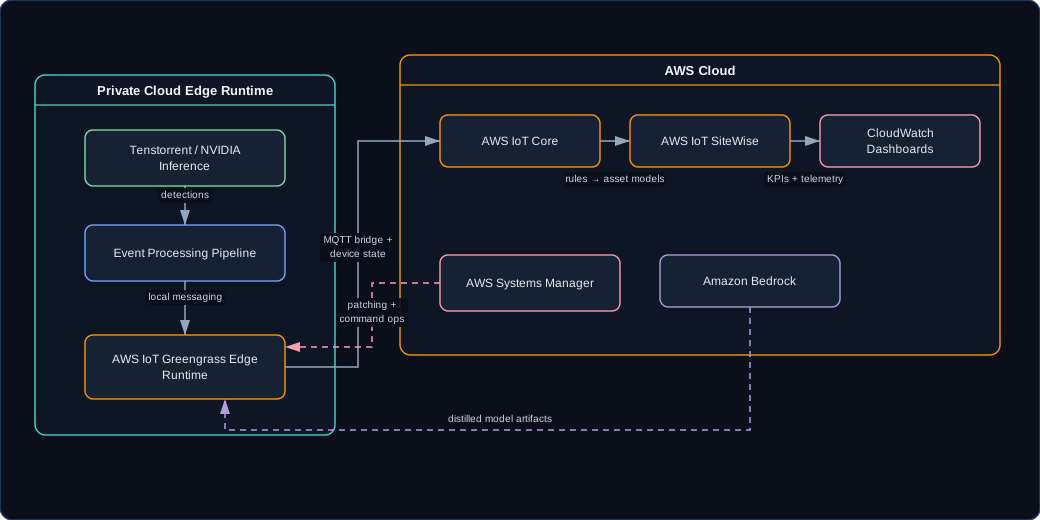
Swap the cloud and the shape survives. Greengrass stands where the AIO edge runtime stood, IoT Core takes over the broker’s cloud-facing half, SiteWise takes the analytics, and the edge inference box in the middle is the same box it was two diagrams ago. That is the claim this whole buildout exists to test.
Local-Only Implementation (Specific Self-Hosted Tools)
 (opens in a new tab)
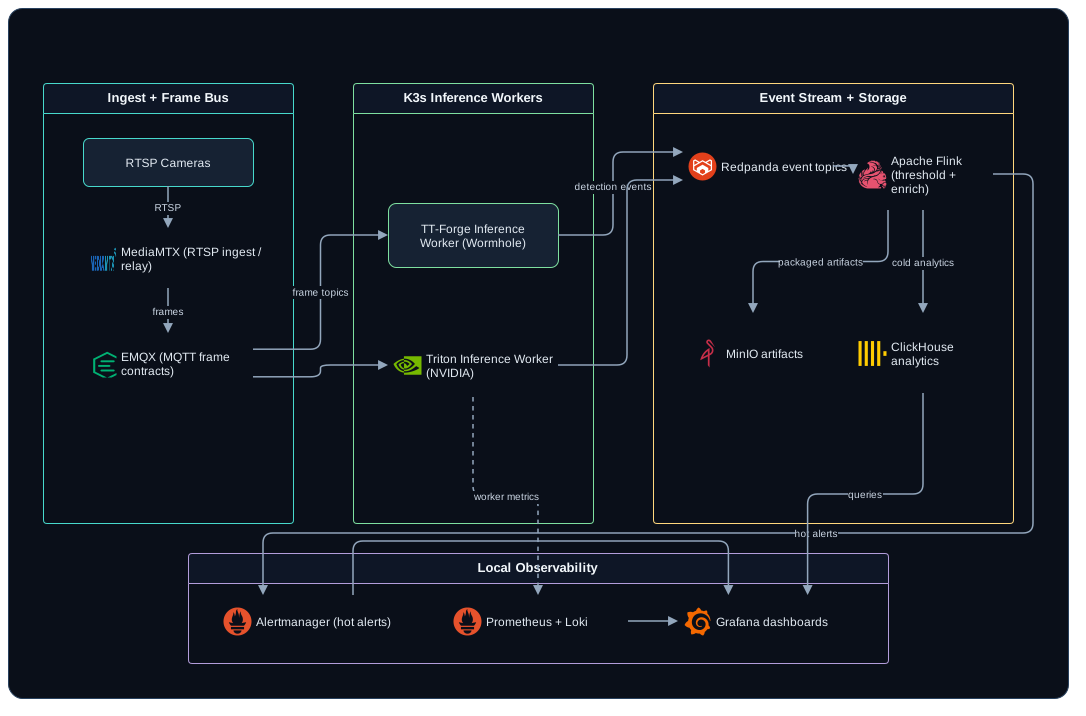
Now the same pipeline with no cloud at all: MediaMTX for RTSP, EMQX for the message bus, and TT-Forge (Tenstorrent’s compiler front end for getting a model onto the cards) and Triton workers on K3s. Each stage is concrete and self-hosted, and still interchangeable by contract. The handoff boundaries are what stay fixed: RTSP ingest, MQTT frame topics, event stream topics, and packaged artifact output.
Physical Lab and Studio Layout
The studio side is optimized for fast context switching. I can record walkthroughs, run live demos, and pivot from one vertical scenario to another without rebuilding the room. The server side is optimized for shared hardware utilization across those same scenarios.
This setup makes it easier to:
- Reuse the same edge hardware for multiple business demos.
- Keep model and telemetry pipelines consistent across environments.
- Demonstrate cloud-assisted operations without requiring cloud-only inference.
- Keep local fallback paths available when connectivity is constrained.
 (opens in a new tab)
Current Lab Inventory
Model numbers matter here, because “Tenstorrent server” and “GPU box” tell you nothing about what will actually fit:
| Host | Hardware | Role |
|---|---|---|
| Wormhole worker | one Tenstorrent Wormhole n150 | active Kubernetes worker for Tenstorrent inference |
| Blackhole host | one Tenstorrent Blackhole p150a | staged, not fully onboarded yet |
| TrueNAS SCALE box | two NVIDIA Tesla P40 (24 GB each), passed through to a Linux VM | Ollama and other model workloads, plus model and media storage |
| Windows RTSP host | commodity desktop | relays the studio cameras as RTSP |
| Studio cameras | two webcams, a high shot and a low shot | the live video source for every demo |
| Proxmox hosts | two general-purpose servers | private-cloud VMs and supporting services |
Twenty-four gigabytes a card is plenty of room for the models I run locally. What the Pascal generation costs me is throughput, not model size: the P40s will load a model the newer cards would run several times faster.
The practical goal is a mixed accelerator lab where workload placement can be tuned by use case, latency target, and cost profile.

Azure Path: IoT Operations, Arc, and Edge Feedback Loops
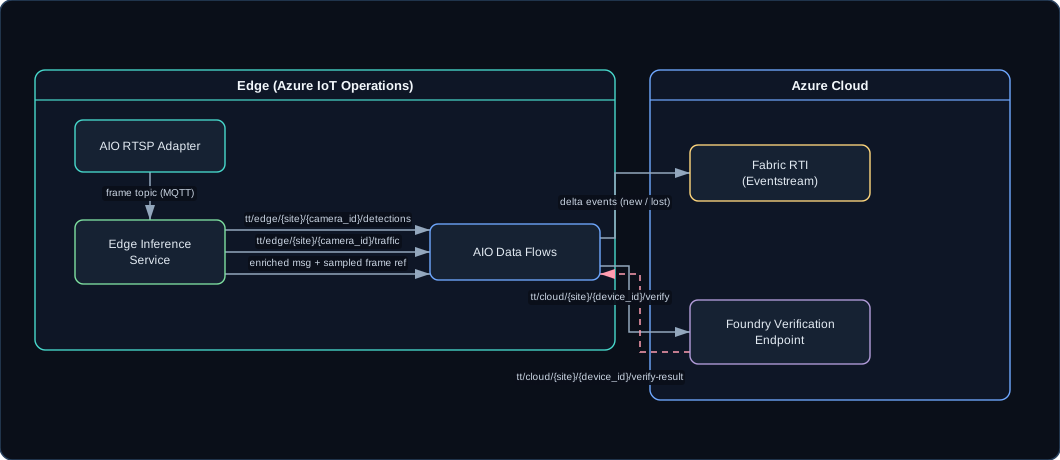
On Azure, the control pattern is centered around Azure IoT Operations on Azure Arc-enabled Kubernetes. The same pattern drives the private demo environment behind this buildout. The local flow is:
- Cameras publish RTSP to the Windows RTSP host.
- The AIO media connector ingests RTSP and publishes frames to the local MQTT frame topic. That connector was still in preview when I checked the Learn docs in September 2026, so check its status before you build on it.
- Edge inference services consume those frame topics and publish detections, traffic, and enriched messages.
- AIO Data Flows process, normalize, and extract delta events.
- Data Flows push upstream to Fabric RTI and forward the verify topic to the cloud. Data flows have a fixed set of destinations - broker, Kafka and Event Hubs, lake and warehouse targets - so this step is routing, not a call.
- A separate verify worker consumes that forwarded stream, calls the Foundry endpoint, and publishes the answer back on the verify-result topic.
- Results flow into cloud analytics and operations dashboards, with feedback updates pushed back to edge.
The topic patterns those hops use look like this. The code behind them is part of my private reference implementation and is not published, so read these as documentation of the design rather than pointers to a repo you can clone:
tt/edge/{site}/{camera_id}/detectionstt/cloud/{site}/{device_id}/verifytt/cloud/{site}/{device_id}/verify-result
The camera fleet in the Cameras on Azure IoT Operations, Part 1: The Control Plane and Network Model is a separate system on its own cameras/# tree; this lab keeps tt/, and nothing bridges the two.
 (opens in a new tab)
Operationally, Arc gives me a consistent management surface for local Kubernetes resources and policy. I am also treating GitOps with Flux on Arc-enabled Kubernetes as the default deployment and configuration strategy for repeatability.
One reason this fits the basement buildout well is that Azure IoT Operations is designed as a unified edge data plane with an industrial MQTT broker and supports routing/normalization before cloud fan-out. That maps directly to how I want to keep high-volume inference local while still enabling cloud-side verification, model lifecycle workflows, and cross-site analytics.
For the Fabric path, I am modeling Data Flows publishing straight into Fabric Real-Time Intelligence through the documented Fabric endpoint configuration, with the eventstream as the ingestion surface. No Event Hub bridge is required on that hop.
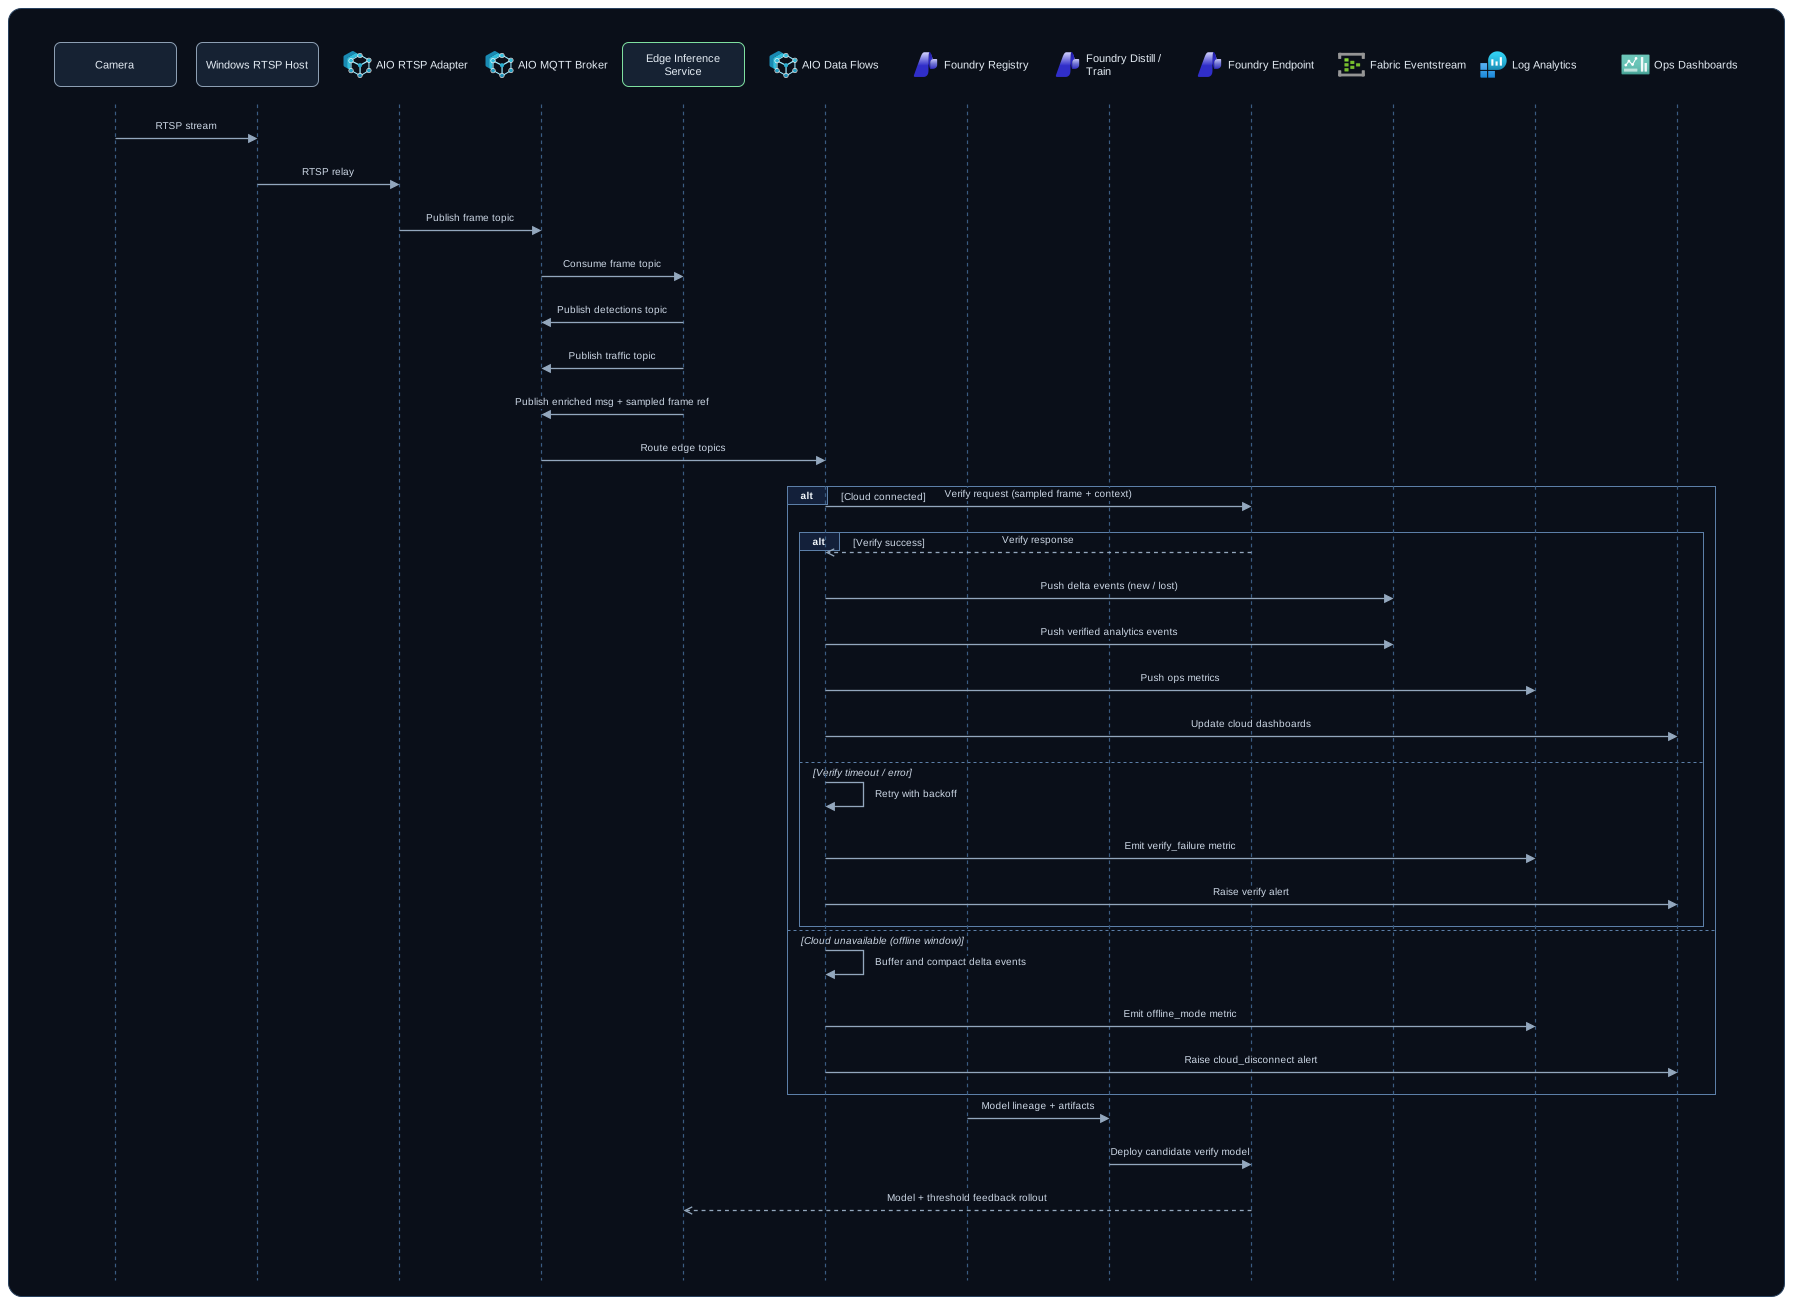 (opens in a new tab)
The card below is the terminology legend for that sequence: what RTSP, MQTT, the Kafka endpoint, a delta event, and an enriched message each mean in these diagrams.
 (opens in a new tab)
AWS Path: Greengrass, IoT Core, SiteWise, Systems Manager, and Bedrock
On AWS, the equivalent pattern uses:
- AWS IoT Greengrass for edge runtime orchestration.
- AWS IoT Core for secure bi-directional cloud messaging and device state.
- AWS IoT SiteWise for industrial telemetry modeling, transforms, and monitoring.
- AWS Systems Manager for hybrid fleet operations, patching, and command execution.
- Amazon Bedrock as part of the cloud-side model specialization and distillation path.
The AWS side is organized to mirror the Azure demo shape where possible, including shared vertical scenarios and analytics assets. The intent is to keep edge behavior portable while changing only cloud control-plane integrations.
At a high level:
- Local inference continues at the edge.
- Edge messaging bridges into AWS IoT Core patterns.
- Industrial telemetry and KPI modeling feed SiteWise analytics.
- Operations and lifecycle tasks route through Systems Manager.
- Distilled cloud-side model workflows can feed edge deployment artifacts.
That gets me enough AWS parity that a fixed cloud preference stays a conversation about integrations instead of turning into a rebuild of the edge.
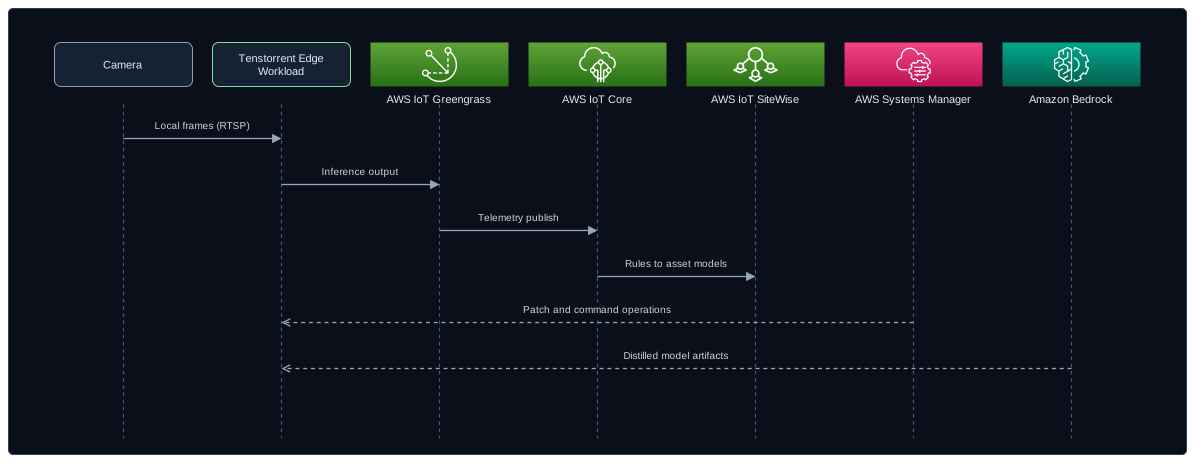 (opens in a new tab)
Cross-Provider Pattern
The architecture pattern stays the same even when control planes differ:
| Layer | Azure | AWS |
|---|---|---|
| Edge inference runtime | Tenstorrent edge service on local K8s | Tenstorrent workloads under Greengrass-managed edge runtime |
| Edge messaging | IoT Operations MQTT broker | IoT Core and Greengrass local messaging patterns |
| Fleet and policy | Arc-enabled infrastructure and GitOps | Systems Manager + IoT fleet operations |
| Industrial analytics | Event flow to cloud analytics services | SiteWise asset model and telemetry analytics |
| Model lifecycle | Cloud verification + model workflows | Bedrock-assisted distillation workflows |
This is the core reason for the buildout: one local edge core, multiple cloud orchestration options, and a purely local fallback.
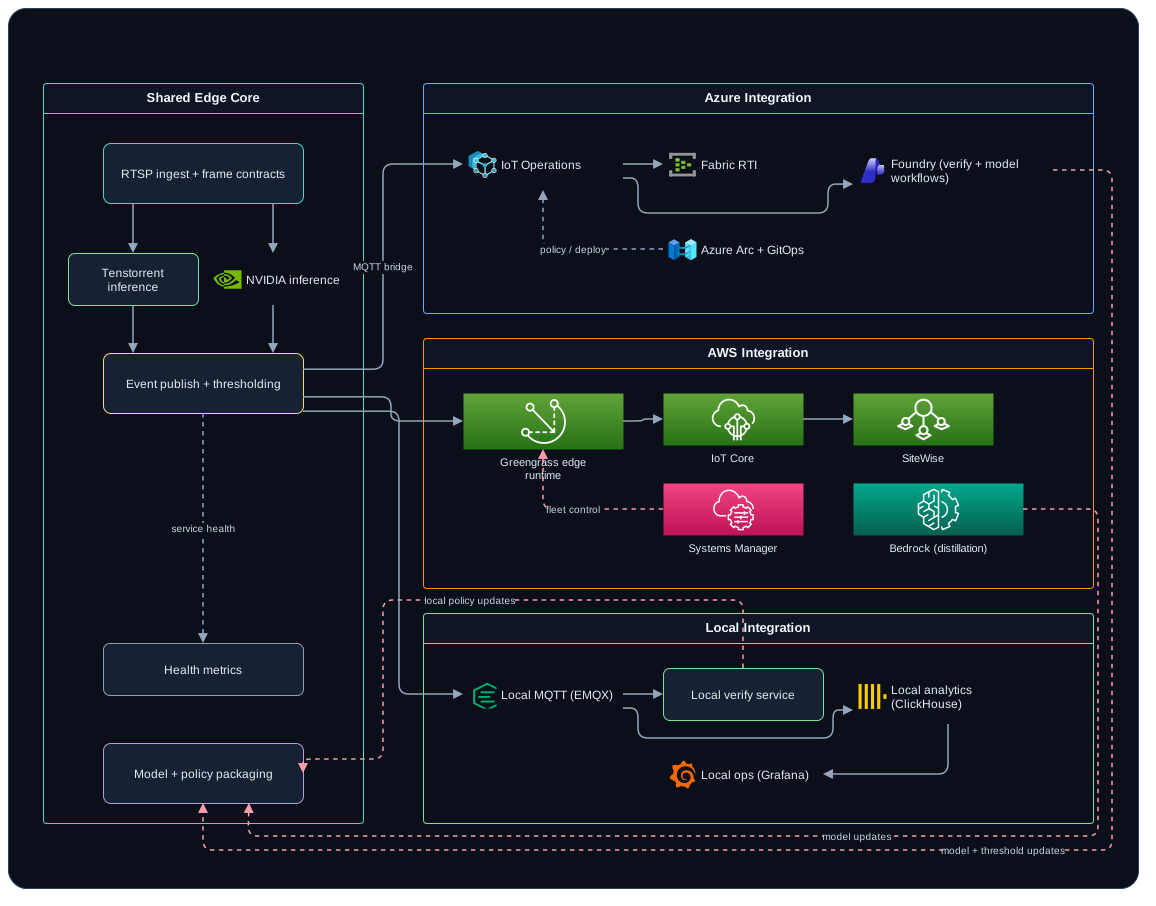 (opens in a new tab)
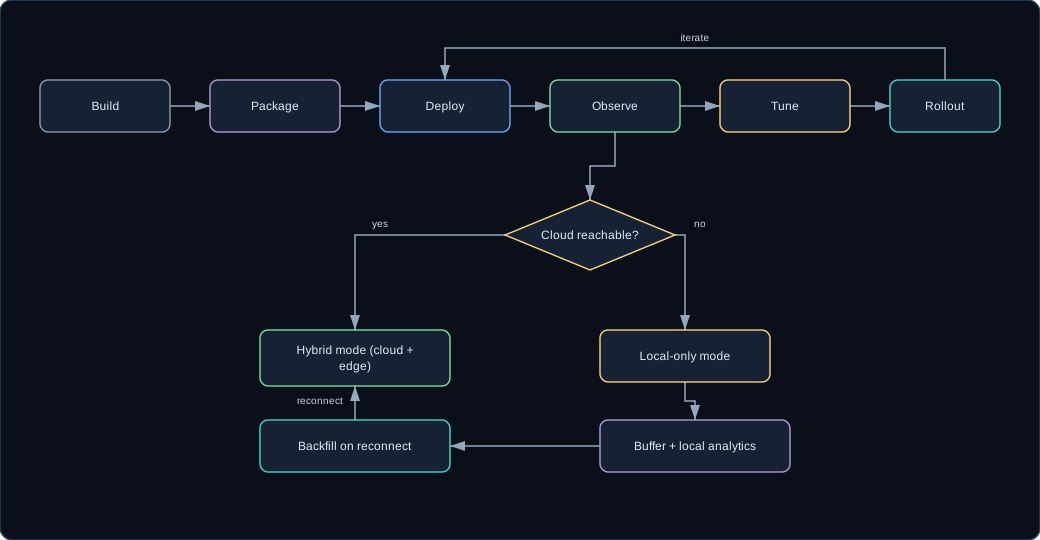 (opens in a new tab)
First Milestone
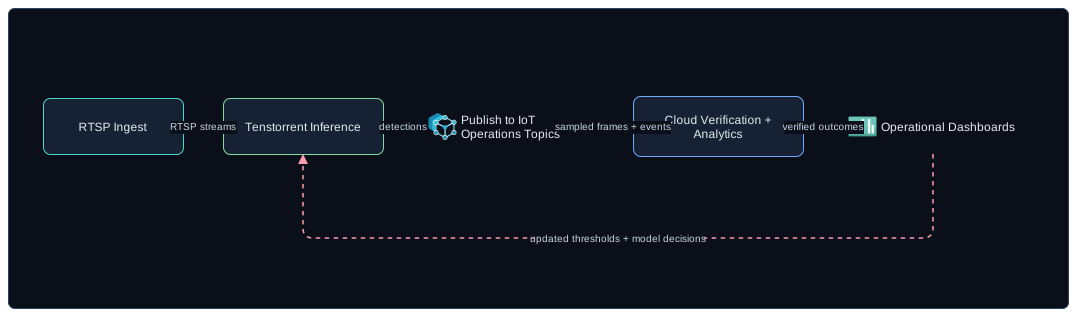
The Azure flow above is the design. The milestone is the half of it I have not closed yet.
Ingest, local inference on the Wormhole host, and publishing structured detections into IoT Operations topics are the tractable part; each is a service with an obvious contract on both sides. The return path is the hard one: verification outcomes and updated thresholds coming back down and changing what the edge does on the next frame, without a human copying a number between two dashboards. Until that runs end to end, what I have is edge inference and cloud analytics sitting next to each other, and a loop only on paper. The loop is the only part of this anyone should be impressed by, so it is what I am building first.
 (opens in a new tab)
Next Steps
- Complete Blackhole onboarding and benchmark against current Wormhole and NVIDIA paths.
- Harden deployment automation across Azure and AWS for faster scenario switching.
- Build out more scenario configurations so the same hardware can stand in for another vertical without a rebuild.
- Add stronger runbook-level operational checks for edge health, topic flow integrity, and model rollout safety.
References
- Azure IoT Operations overview
- Send data to Microsoft Fabric Real-Time Intelligence
- Media connector (preview)
- Azure Arc overview
- Azure Arc-enabled Kubernetes overview
- GitOps with Flux v2 on Azure Arc-enabled Kubernetes
- AWS IoT Greengrass overview
- AWS IoT Core overview
- AWS IoT SiteWise overview
- AWS Systems Manager overview
- Amazon Bedrock overview
- Tenstorrent documentation home
- Tenstorrent TT-Forge documentation
- Tenstorrent Wormhole hardware
- Tenstorrent Blackhole hardware